Showing posts with label PSSCOR2. Show all posts

Debugging Tip: How to explore a method's MSIL & Assembly code


Introduction

In this post I'd like to shortly present how to explore a method's MSIL Code and also its corresponding Assembly Code.

Some internal issues could be resolved while exploring the method assembly code and quite often its MSIL instruction code.


Remark:
For this debugging session I used the WinDbg tool with the PSSCOR2 debugging extension. However we could use other debugging extensions (such as: SOS, SOSEX, PSSCOR4) to perform & achieve the same result.


Example


1.      We could use the '!CLRStack' command to find the desired method in the thread call stack.

           -        Command: !CLRStack

           -        Example:

0:000> !CLRStack

OS Thread Id: 0x1a64 (0)
ESP       EIP    
001ded3c 006a016d TestPerfExample.Program.DebuggingExample1()
001ded94 006a009a TestPerfExample.Program.Main(System.String[])

001deff8 68b31b4c [GCFrame: 001deff8]


2.      We could use the '!name2ee' command to turn a method name into a MethodDesc.

            -        Command: !name2ee

            -        Example:

0:000>  !name2ee TestPerfExample!TestPerfExample.Program.DebuggingExample1

Module: 002a2f2c (TestPerfExample.exe)
Token: 0x06000008
MethodDesc: 002a330c
Name: TestPerfExample.Program.DebuggingExample1()
JITTED Code Address: 006a00c0


Explore the method's MSIL Code:


3.      Now we could use the '!DumpIL' command with the MethodDesc address (retrieved from the previous command - 002a330c) to observe the method's MSIL Code.

           -        Command: !DumpIL

           -        Example:

0:000> !DumpIL 002a330c

ilAddr = 010a20ec
IL_0000: nop
IL_0001: ldc.i4.s 97
IL_0003: stloc.0
IL_0004: newobj TestPerfExample.Person::.ctor
IL_0009: stloc.1
IL_000a: ldloc.1
IL_000b: ldc.i4.3
IL_000c: callvirt TestPerfExample.Person::set_Id
IL_0011: nop
IL_0012: newobj TestPerfExample.Person::.ctor
IL_0017: stloc.2
IL_0018: ldloc.2
IL_0019: ldc.i4.5
IL_001a: callvirt TestPerfExample.Person::set_Id
IL_001f: nop
IL_0020: ldloc.2
IL_0021: callvirt TestPerfExample.Person::get_Id
IL_0026: call System.Console::WriteLine
IL_002b: nop
IL_002c: ret


Explore the method's Assembly Code:


4.      In order to observe the method's assembly code, we'll first use the '!DumpMD' command to retrieve its method description information, using the MethodDesc address.

           -        Command: !DumpMD

           -        Example:

0:000> !DumpMD 002a330c

Method Name: TestPerfExample.Program.DebuggingExample1()
Class: 002a13d8
MethodTable: 002a3338
mdToken: 06000008
Module: 002a2f2c
IsJitted: yes
m_CodeOrIL: 006a00c0


5.      Now we could use the '!U' command with the m_CodeOrIL address (retrieved from the previous command - 006a00c0) to observe the method's assembly code.

           -        Command: !U

           -        Example:

0:000> !U -gcinfo -ehinfo 006a00c0

Normal JIT generated code
TestPerfExample.Program.DebuggingExample1()
Begin 006a00c0, size b6
>>> 006a00c0 55              push    ebp
006a00c1 8bec            mov     ebp,esp
006a00c3 57              push    edi
006a00c4 56              push    esi
006a00c5 53              push    ebx
006a00c6 83ec44          sub     esp,44h
006a00c9 8d7dc8          lea     edi,[ebp-38h]
006a00cc b90b000000      mov     ecx,0Bh
006a00d1 33c0            xor     eax,eax
006a00d3 f3ab            rep stos dword ptr es:[edi]
006a00d5 33c0            xor     eax,eax
006a00d7 8945e4          mov     dword ptr [ebp-1Ch],eax
006a00da 833de4302a0000  cmp     dword ptr ds:[2A30E4h],0
006a00e1 7405            je      006a00e8
006a00e3 e8f1197168      call    mscorwks!JIT_DbgIsJustMyCode (68db1ad9)
006a00e8 33d2            xor     edx,edx
006a00ea 8955bc          mov     dword ptr [ebp-44h],edx
006a00ed 33d2            xor     edx,edx
006a00ef 8955c0          mov     dword ptr [ebp-40h],edx
006a00f2 c745c400000000  mov     dword ptr [ebp-3Ch],0
006a00f9 90              nop
006a00fa c745c461000000  mov     dword ptr [ebp-3Ch],61h
006a0101 b9c4332a00      mov     ecx,2A33C4h
006a0106 e8111fbfff      call    0029201c (JitHelp: CORINFO_HELP_NEWSFAST)
004B        reg EAX becoming live
006a010b 8945b8          mov     dword ptr [ebp-48h],eax
006a010e 8b4db8          mov     ecx,dword ptr [ebp-48h]
0051        reg ECX becoming live
006a0111 e84abfc0ff      call    002ac060 (TestPerfExample.Person..ctor(), mdToken: 06000003)
0056        reg EAX becoming dead
0056        reg ECX becoming dead
006a0116 8b45b8          mov     eax,dword ptr [ebp-48h]
0059        reg EAX becoming live
006a0119 8945c0          mov     dword ptr [ebp-40h],eax
006a011c 8b4dc0          mov     ecx,dword ptr [ebp-40h]
005F        reg ECX becoming live
006a011f ba03000000      mov     edx,3
006a0124 3909            cmp     dword ptr [ecx],ecx
006a0126 e82dbfc0ff      call    002ac058 (TestPerfExample.Person.set_Id(Int32), mdToken: 06000002)
006B        reg EAX becoming dead
006B        reg ECX becoming dead
006a012b 90              nop
006a012c b9c4332a00      mov     ecx,2A33C4h
006a0131 e8e61ebfff      call    0029201c (JitHelp: CORINFO_HELP_NEWSFAST)
0076        reg EAX becoming live
006a0136 8945b4          mov     dword ptr [ebp-4Ch],eax
006a0139 8b4db4          mov     ecx,dword ptr [ebp-4Ch]
007C        reg ECX becoming live
006a013c e81fbfc0ff      call    002ac060 (TestPerfExample.Person..ctor(), mdToken: 06000003)
0081        reg EAX becoming dead
0081        reg ECX becoming dead
006a0141 8b45b4          mov     eax,dword ptr [ebp-4Ch]
0084        reg EAX becoming live
006a0144 8945bc          mov     dword ptr [ebp-44h],eax
006a0147 8b4dbc          mov     ecx,dword ptr [ebp-44h]
008A        reg ECX becoming live
006a014a ba05000000      mov     edx,5
006a014f 3909            cmp     dword ptr [ecx],ecx
006a0151 e802bfc0ff      call    002ac058 (TestPerfExample.Person.set_Id(Int32), mdToken: 06000002)
0096        reg EAX becoming dead
0096        reg ECX becoming dead
006a0156 90              nop
006a0157 8b4dbc          mov     ecx,dword ptr [ebp-44h]
009A        reg ECX becoming live
006a015a 3909            cmp     dword ptr [ecx],ecx
006a015c e8efbec0ff      call    002ac050 (TestPerfExample.Person.get_Id(), mdToken: 06000001)
00A1        reg ECX becoming dead
006a0161 8945b0          mov     dword ptr [ebp-50h],eax
006a0164 8b4db0          mov     ecx,dword ptr [ebp-50h]
006a0167 e8244d0668      call    mscorlib_ni+0x6d4e90 (68704e90) (System.Console.WriteLine(Int32), mdToken: 060007c4)
006a016c 90              nop
006a016d cc              int     3
006a016e 8d65f4          lea     esp,[ebp-0Ch]
006a0171 5b              pop     ebx
006a0172 5e              pop     esi
006a0173 5f              pop     edi
006a0174 5d              pop     ebp
006a0175 c3              ret


Summary

We managed to observe how to retrieve a desired method's MSIL and Assembly code with only few commands.

We used the WinDbg tool (part of the 'Debugging Tools for Windows') and in this session I used the 'psscor2.dll' debugging extension.

For additional related articles, please see the list appears at the beginning of this post.


The End
Hope you enjoyed!
Appreciate your comments…

Yonatan Fedaeli


How to: Extract code from a dump file


Dump file -> WinDbg -> .Net Code


Introduction

Sometimes when we are debugging a Dump file analyzing a performance issue (e.g. Hang, Crash, Exceptions, memory pressure etc.) we don't necessarily possess the actual code (DLL, EXE) for any reason. (E.g. a friend sent us the dump file w/o its corresponding code)

In such cases, when we encounter a problem that requires examining the source code, it's possible to save the managed code to a file (managed binary), and then disassemble it using a de-compiler, such as: .Net Reflector, ILDASM, ILSpy etc.

In this post I'll demonstrate a simple process with a Hang issue (the process is exploiting lots of CPU time), and how to restore the source code from its corresponding Dump file.

I'll use the PSSCOR2 debugger extension.


Demo - planning

In this demo we'll perform the following:
            1.      Create a simple class.
            2.      Build the code.
            3.      Run the code.
            4.      Generate a Dump file using 'Task Manager'.
            5.      Open the Dump file in WinDbg.
            6.      Extract the code from the Dump.
            7.      Open the new EXE in a De-compiler.
            8.      Summary & Conclusions.


Demo

1.     Create a simple class:

I've created the following simple class to illustrate a Hang issue, meaning the process is exploiting a lot of CPU time.

I named the file Demo1.cs, and saved it under: E:\MyCode\FromDumpFileToCode\Demo1.cs


      -        As you could see from the code above, it's a simple Main() method with an infinite 'while loop' that keeps incrementing a variable.
      -        This should cause a Hang issue in our process, since it's never advance to the next instruction, and always consume CPU time.


2.     Build the code:

Next, I built the code using the C# compiler (csc.exe) in the 'Developer Command Prompt for VS2015'.

E:\MyCode\FromDumpFileToCode>csc Demo1.cs

Microsoft (R) Visual C# Compiler version 1.1.0.51204
Copyright (C) Microsoft Corporation. All rights reserved.


3.     Run the code:

I run the code and examined 'Windows Task Manager' and verified that the process is Hang.


As we could see from the image above, the Demo1.exe process is taking as much as 25% from the entire CPU usage, thus it's Hang.


4.     Generate a Dump file using 'Task Manager':


After taking the Dump file, I terminated the process and opened WinDbg with the 'Demo1.DMP' dump file.


5.     Open the Dump file in WinDbg:

I opened the 'Demo1.DMP' dump file and performed the following:

           -        Loaded symbols.
           -        Set symbols local path.
           -        Loaded the PSSCOR2 debugger extension (psscor2.dll).
           -        Loaded the CLR debugging modules (mscordacwks.dll).


0:000> .symfix

DBGHELP: Symbol Search Path:
DBGHELP: Symbol Search Path: cache*;SRV*http://msdl.microsoft.com/download/symbols

0:000> .sympath+ E:\MyCode\FromDumpFileToCode
DBGHELP: Symbol Search Path: cache*;SRV*http://msdl.microsoft.com/download/symbols;e:\mycode\fromdumpfiletocode

. . .

0:000> .load psscor2

0:000> .chain
Extension DLL search Path:

    C:\Program Files\Windows Kits\8.1\Debuggers\x86\WINXP;

Extension DLL chain:
    psscor2: image 2.0.0.1, API 1.0.0, built Wed Mar 24 21:24:57 2010
        [path: C:\Program Files\Windows Kits\8.1\Debuggers\x86\psscor2.dll]
    dbghelp: image 6.3.9600.17237, API 6.3.6, built Wed Jul 16 20:35:59 2014
        [path: C:\Program Files\Windows Kits\8.1\Debuggers\x86\dbghelp.dll]

. . .
   
0:000> .cordll -ve -u –l

Automatically loaded SOS Extension

CLRDLL: Loaded DLL C:\Windows\Microsoft.NET\Framework\v4.0.30319\mscordacwks.dll
CLR DLL status: Loaded DLL C:\Windows\Microsoft.NET\Framework\v4.0.30319\mscordacwks.dll


0:000> !Threads
ThreadCount:      2
UnstartedThread:  0
BackgroundThread: 1
PendingThread:    0
DeadThread:       0
Hosted Runtime:   no
                                                                         Lock 
       ID OSID ThreadOBJ    State GC Mode     GC Alloc Context  Domain   Count Apt Exception
   0    1 1098 002952c0     2a020 Cooperative 01CD271C:00000000 0028d4a8 0     MTA
   2    2 1a1c 002a2050     2b220 Preemptive  00000000:00000000 0028d4a8 0     MTA (Finalizer)


6.     Extract the code from the Dump:

We are using the PSSCOR2 '!SaveModule' command to save the code from the Dump file to new EXE file.

The !SaveModule command takes 2 parameters:

1.     Base Address
-        We could find the image base address using the 'LM' debugger command.
-        Alternately, we could use the module name, as it appears in the 'LM' command output.
2.     File Name (and path)


First, we'll list the loaded modules, and copy the module base address:

0:000> lm

start    end        module name

010c0000 010c8000   Demo1      (deferred)            
50ff0000 516a1000   clr        (pdb symbols)          C:\ProgramData\dbg\sym\clr.pdb\1C6AD585F62042AEB690C4C105CB9B962\clr.pdb
53000000 530f5000   MSVCR120_CLR0400   (deferred)            
6aef0000 6af69000   mscoreei   (deferred)            
6af70000 6afba000   mscoree    (deferred)             
6c420000 6c49e000   clrjit     (deferred)            
6dfe0000 6e01f000   snxhk      (deferred)            

. . .

76f30000 7706c000   ntdll      (pdb symbols)          C:\ProgramData\dbg\sym\ntdll.pdb\CD4062A231154A17A18DAE7D1A0FBACC2\ntdll.pdb
77090000 77159000   user32     (deferred)            
79240000 7a38a000   mscorlib_ni   (deferred)


Next, we'll run the !SaveModule command, with the Base address and a File Name to save the new generated EXE file:

0:000> !SaveModule Demo1.exe E:\MyCode\FromDumpFileToCode\Code\NewDemo1.exe

3 sections in file
section 0 - VA=2000, VASize=4d8, FileAddr=200, FileSize=600
section 1 - VA=4000, VASize=4ac, FileAddr=800, FileSize=600
section 2 - VA=6000, VASize=c, FileAddr=e00, FileSize=200


We could see from the command output that the operation was successful, and we could find the new generated executable (source code) in the desired folder:

E:\MyCode\FromDumpFileToCode\Code>dir /b

NewDemo1.exe


7.     Open the new EXE in a De-compiler:

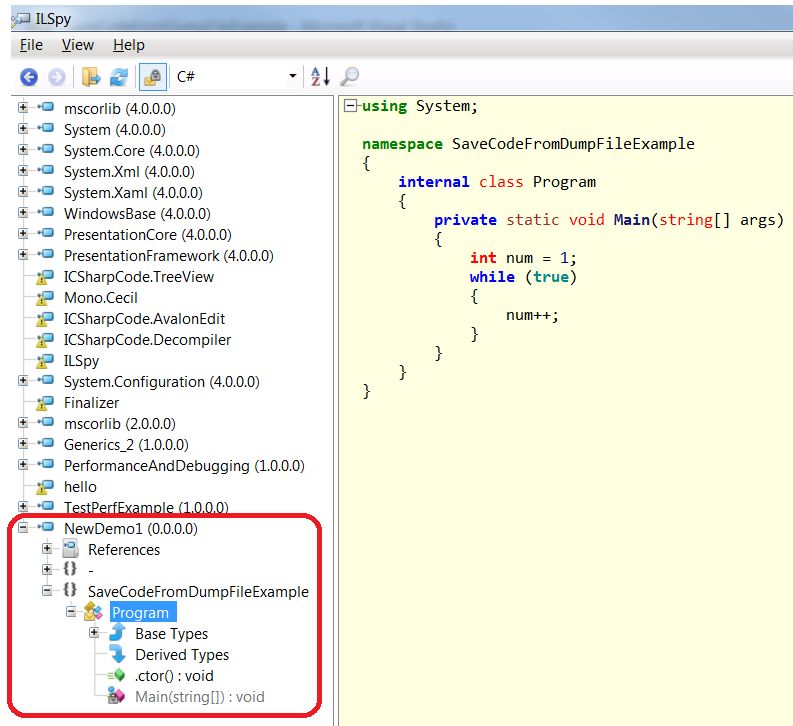
In this example I used ILSpy and was able to review the C# code of the problem I encountered in the Dump file.
This could help resolving the issue.


Summary & Conclusions  

We learned & demonstrated how to extract the managed source code from a Dump file and saved it to a binary file, in cases we don't have the original code and we need to explore it.
We performed it using the PSSCOR2 debugger extension, using the !SaveModule command.


The End

Hope you enjoyed!
Appreciate your comments…

Yonatan Fedaeli